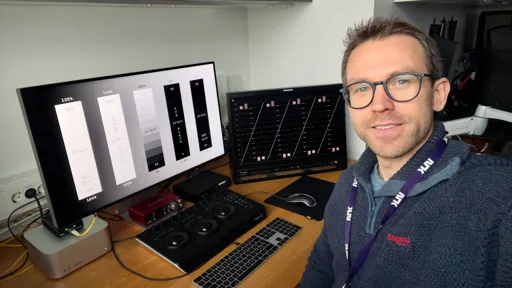
Thomas Berglund (NRK)
More and more broadcasters are either testing or already producing live HDR (high dynamic range) video content. While HDR displays are becoming more common, most viewers today are still watching content on displays only capable of displaying SDR (standard dynamic range). Hence, we want to provide the best possible SDR signal when down-mapping live HDR content for SDR displays.
Within a video signal there is a certain amount of headroom above and below nominal video range, 0% to 100%, from black to white. For live HDR production we can use part of this headroom (down to -5% and up to 105%) in the down-mapped SDR distribution signal to achieve even better perceived contrast and some additional detail in highlights. Using part of this headroom also reduces round-trip losses when mixing SDR and HDR content in a live HDR production workflow.
The EBU recommendation R 103 sets out the permissible levels for video signals and specifies the recommended max/ min range when using the headroom outside nominal video range. R 103 can appear quite theoretical when you read through it, and it can be difficult to understand how to test whether your signal chain can use that additional headroom, as recommended by the EBU.
Bright idea
I learned about this while attending an HDR workshop organized by the EBU at SWR in Baden-Baden in May 2022. At the time, I found it difficult to understand how to easily verify these video signal levels, but after much research and testing I came up with the idea of creating a test chart that could help make this easier. The main goal was to have something that could be used to verify video signal levels according to the EBU R 103 specifications, to visualize this every step of the way through a video signal chain and figure out where you are potentially clipping your signal. Using the test chart, you can simply monitor the video signal through the different stages of your signal chain and check the signal on a waveform scope. At a glance, you can quickly check on the waveform scope whether you see bars below and above 0-100% and thus know if the signal is clipping or not.
I first tried to create a Python script that would generate the test chart but couldn’t get the precision required. I then decided to try using the Blackmagic Design DCTL1 scripting language from the widely used DaVinci Resolve Studio software. The 32-bit float precision it offers allowed me to get very accurate representations of the specific code values in a 10-bit uncompressed YUV 4:2:2 video signal.
For those who want to analyse the signal in more detail, beyond looking at a waveform scope, the chart is 100% accurate; and the 10-bit code values can be inspected with data analyser tools to check exactly how much of the 10-bit value range is being allowed through the signal chain.
The chart is available for download as a 10-bit uncompressed YUV 4:2:2 QuickTime video file (v210). For those who want to create something customized, the DCTL code is also freely available and fully open source. A video tutorial showing how the test chart is created is available to view on the EBU website.
Video signal levels can be a confusing topic for anybody working in the video post- production or video production chain. Hopefully, you find this information and test chart helpful. I have some ideas for new additions to EBU R 103 to help explain more about how video signal levels are mapped to the display, but that is for another time.
Find more information, links to the test chart and other resources here.
This article first appeared in issue 58 of EBU tech-i magazine.
