The EBU has published a new electronic chart to rapidly identify some of the most common issues encountered when setting up a High Dynamic Range (HDR) monitoring system. The so-called "EOTF Chart for HDR Calibration and Monitoring" is based on a similar chart used at Canadian EBU Member CBC/Radio-Canada and is published as EBU Tech 3374. Also available are a TIFF implementation and a ProRes implementation of the test chart.
Easy to use
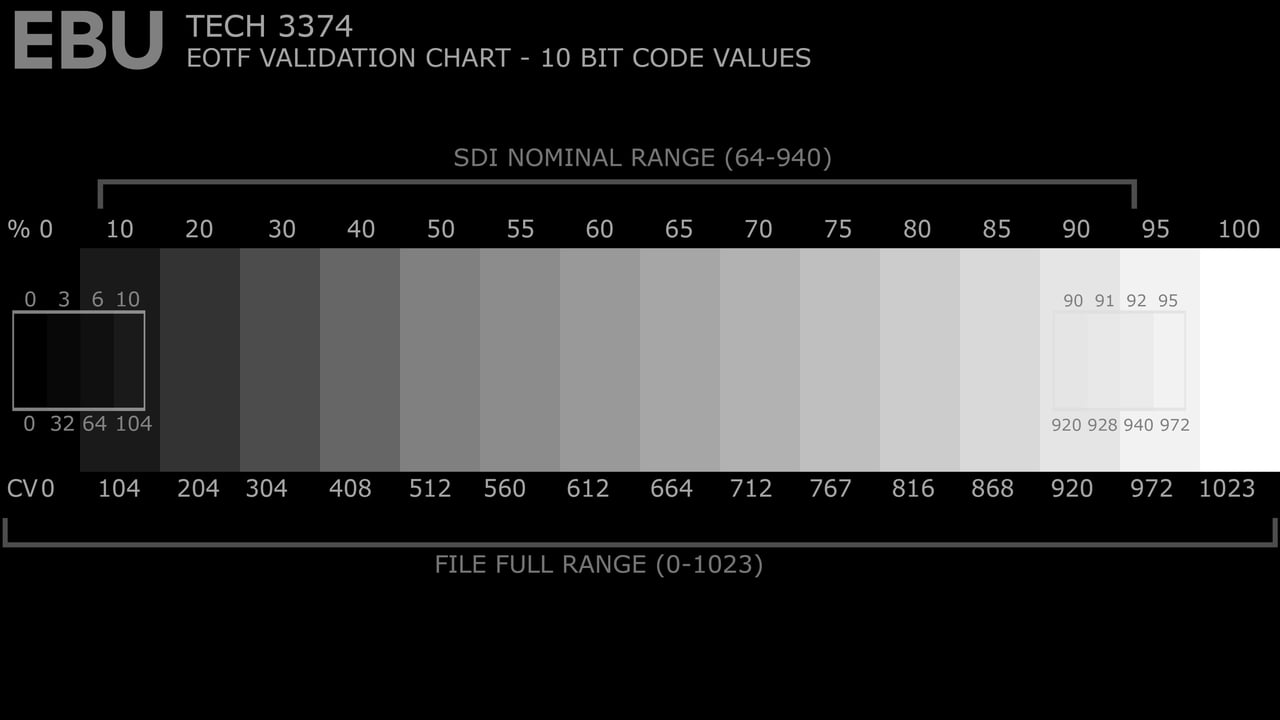
EBU Tech 3374 is NOT intended to accurately measure a display’s Dynamic Range, but intended as a visual test to see if code values are output as intended.
The new chart helps to verify that the video chain used for monitoring covers the specified dynamic range, regardless of the EOTF ('electro-optical transfer function', e.g. HLG, PQ, SLog3) and bit-depth (8, 10, 12 or 16-bit per colour) used. White point errors can be spotted, too. Errors in an HDR setup can easily occur for many reasons, such as incorrect converter settings, mistakes in the capture card configuration, inappropriate monitor configuration, and others.
How to use the chart
A quick explanation of how to use the chart is available in the form of this tutorial video.
The EBU EOTF Chart is part of a series of HDR-related activities by the EBU Video Systems group.